

Oshu was launching an analytics platform for crypto investors. The main goal was to reduce the constant switching between charts, research and metrics that are typically scattered across different services. We needed to bring the full range of data together in one product, design the architecture, interface and visual system, and then create a foundation for the platform’s further development.
Oshu
UX/UI and branding for a crypto investor analytics platform
Context
What we did
- Defined the MVP scope and connected the platform’s main sections into a single structure.
- Designed the product architecture and key user journeys.
- Developed the product’s visual concept, the app and landing page UX/UI, graphics and illustrations.
- Built a design system and prepared the product for development and future iterations.
Outcome
The client received 60+ screens, key user journeys and MVP product states, as well as a design system with a UI kit. For the next five months, we supported Oshu’s product team and helped implement the solutions.
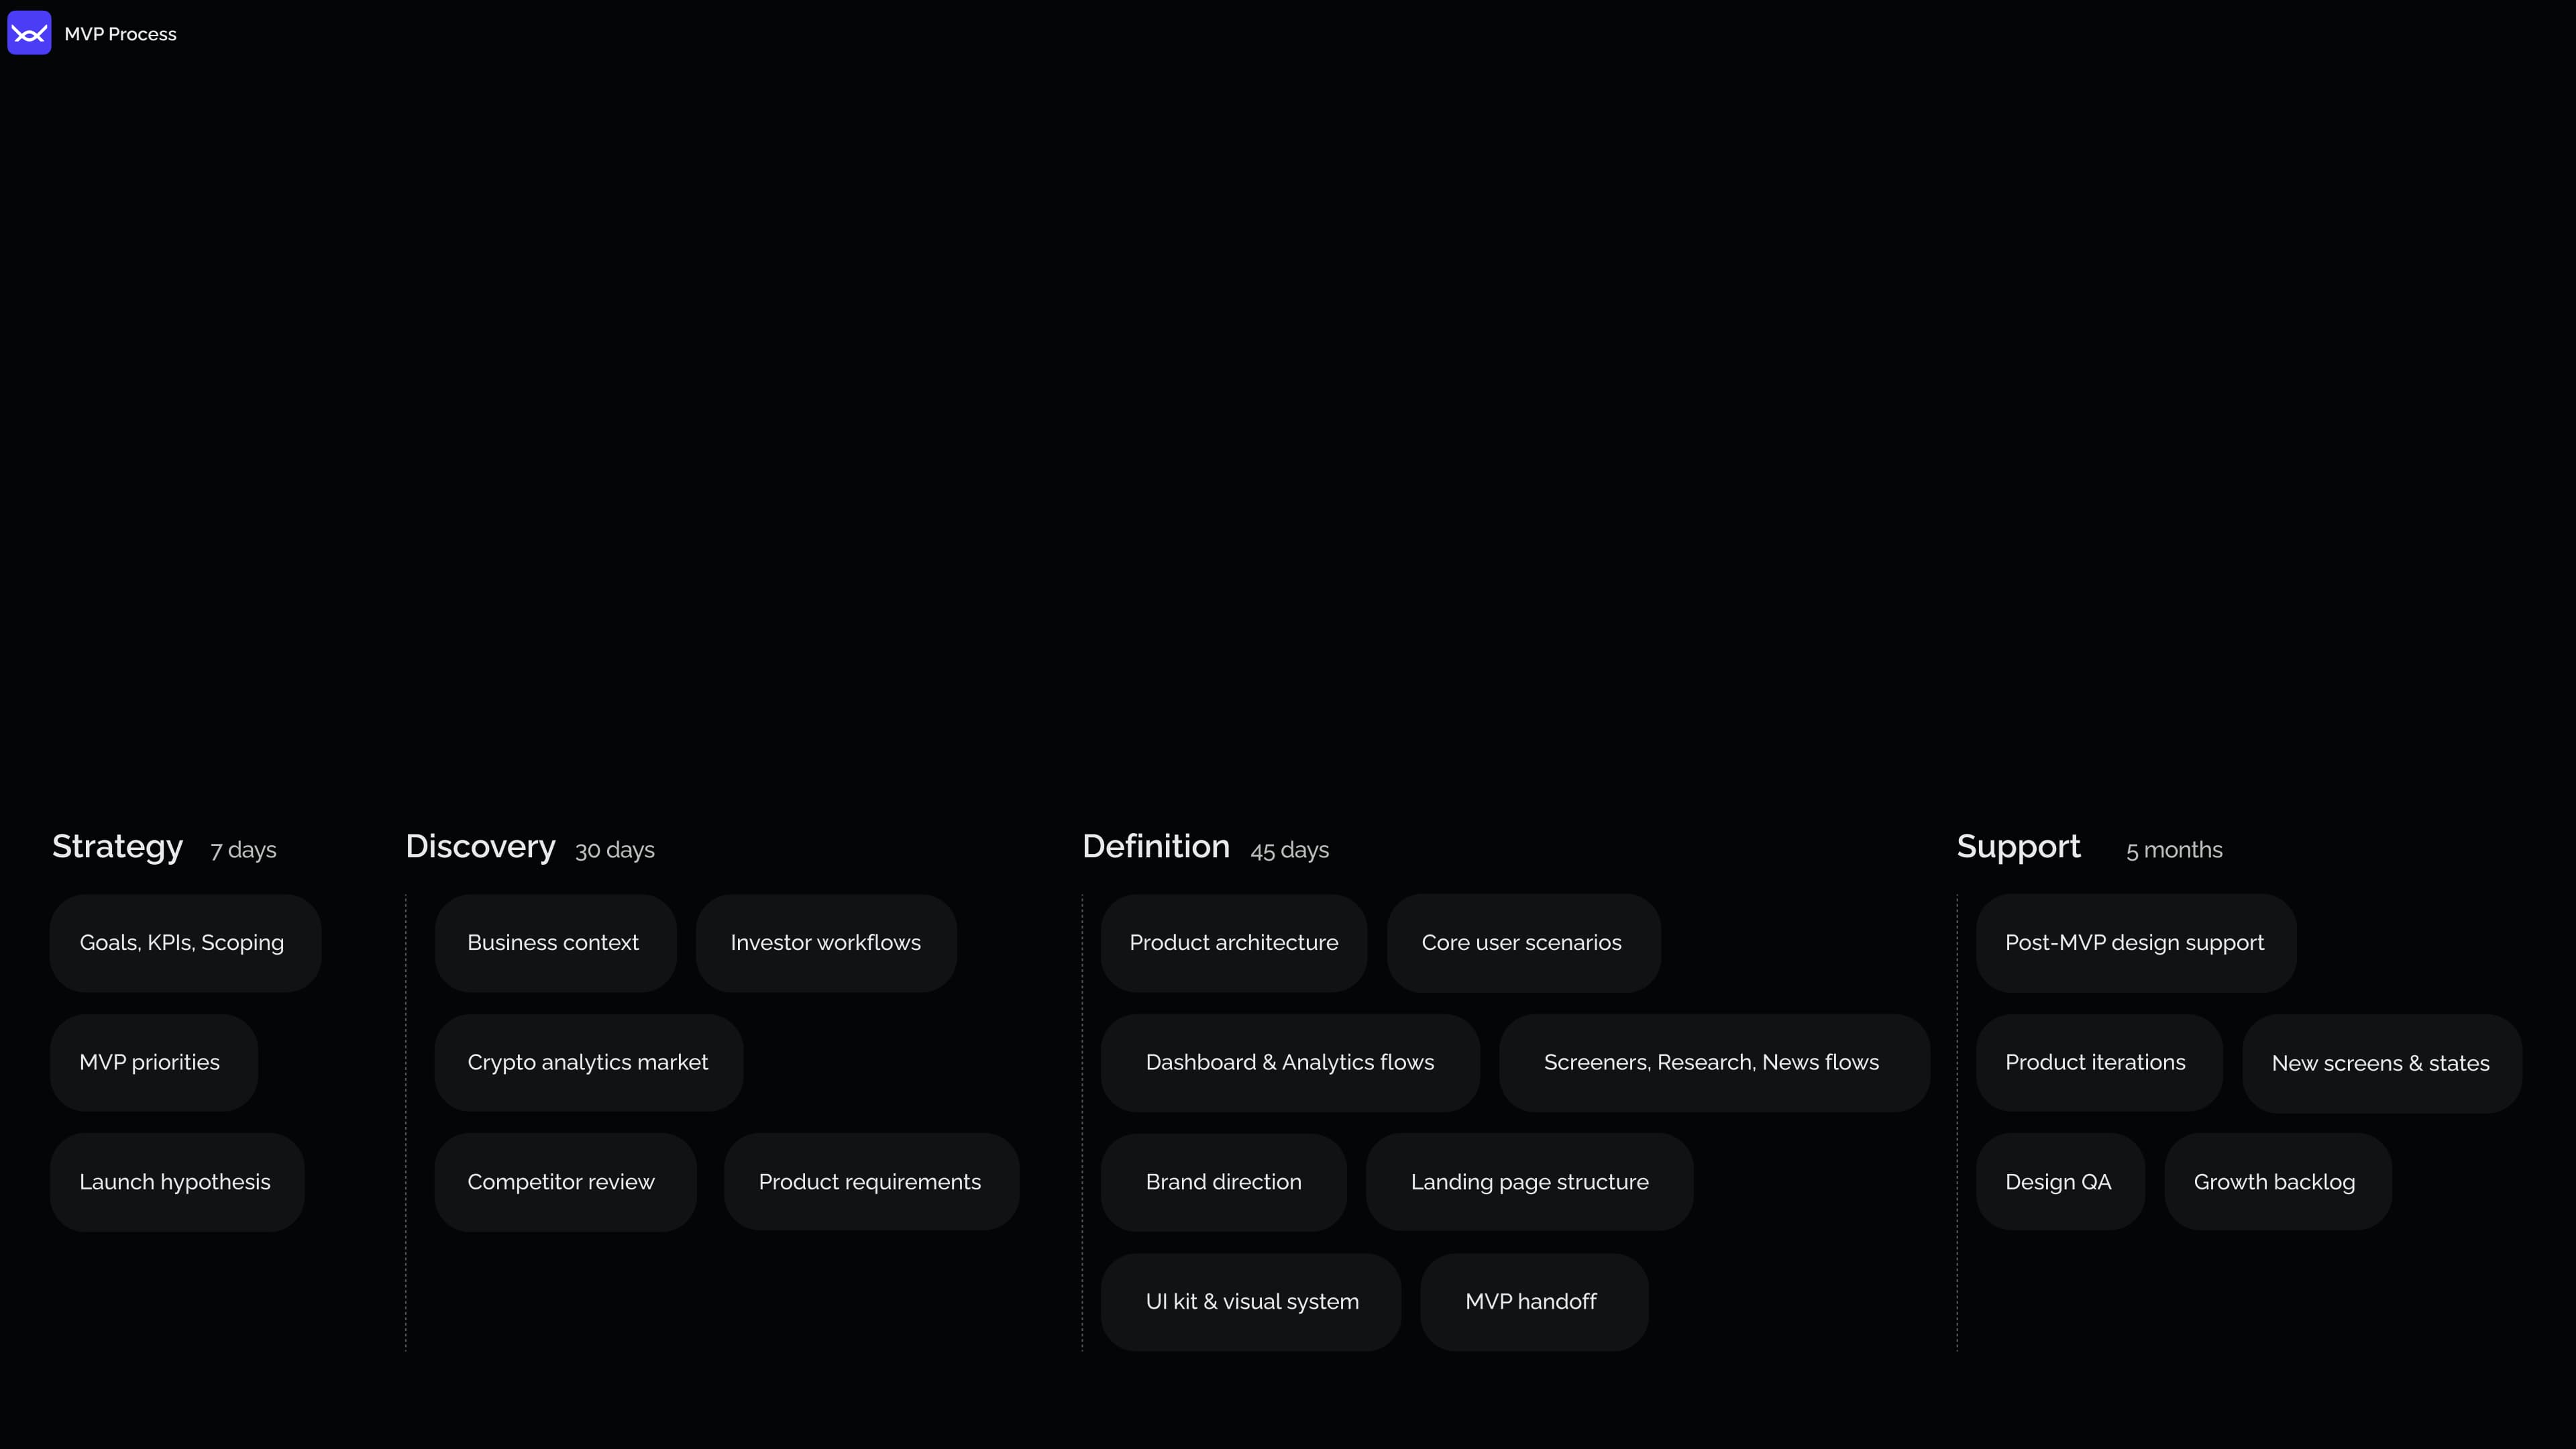
MVP SCOPE
We analysed how investors work with data, from a broad market overview and asset comparison to in-depth analytics. The research phase defined the scope of the product’s first version. It included sign-in and the dashboard, analytics, screeners, research and news.
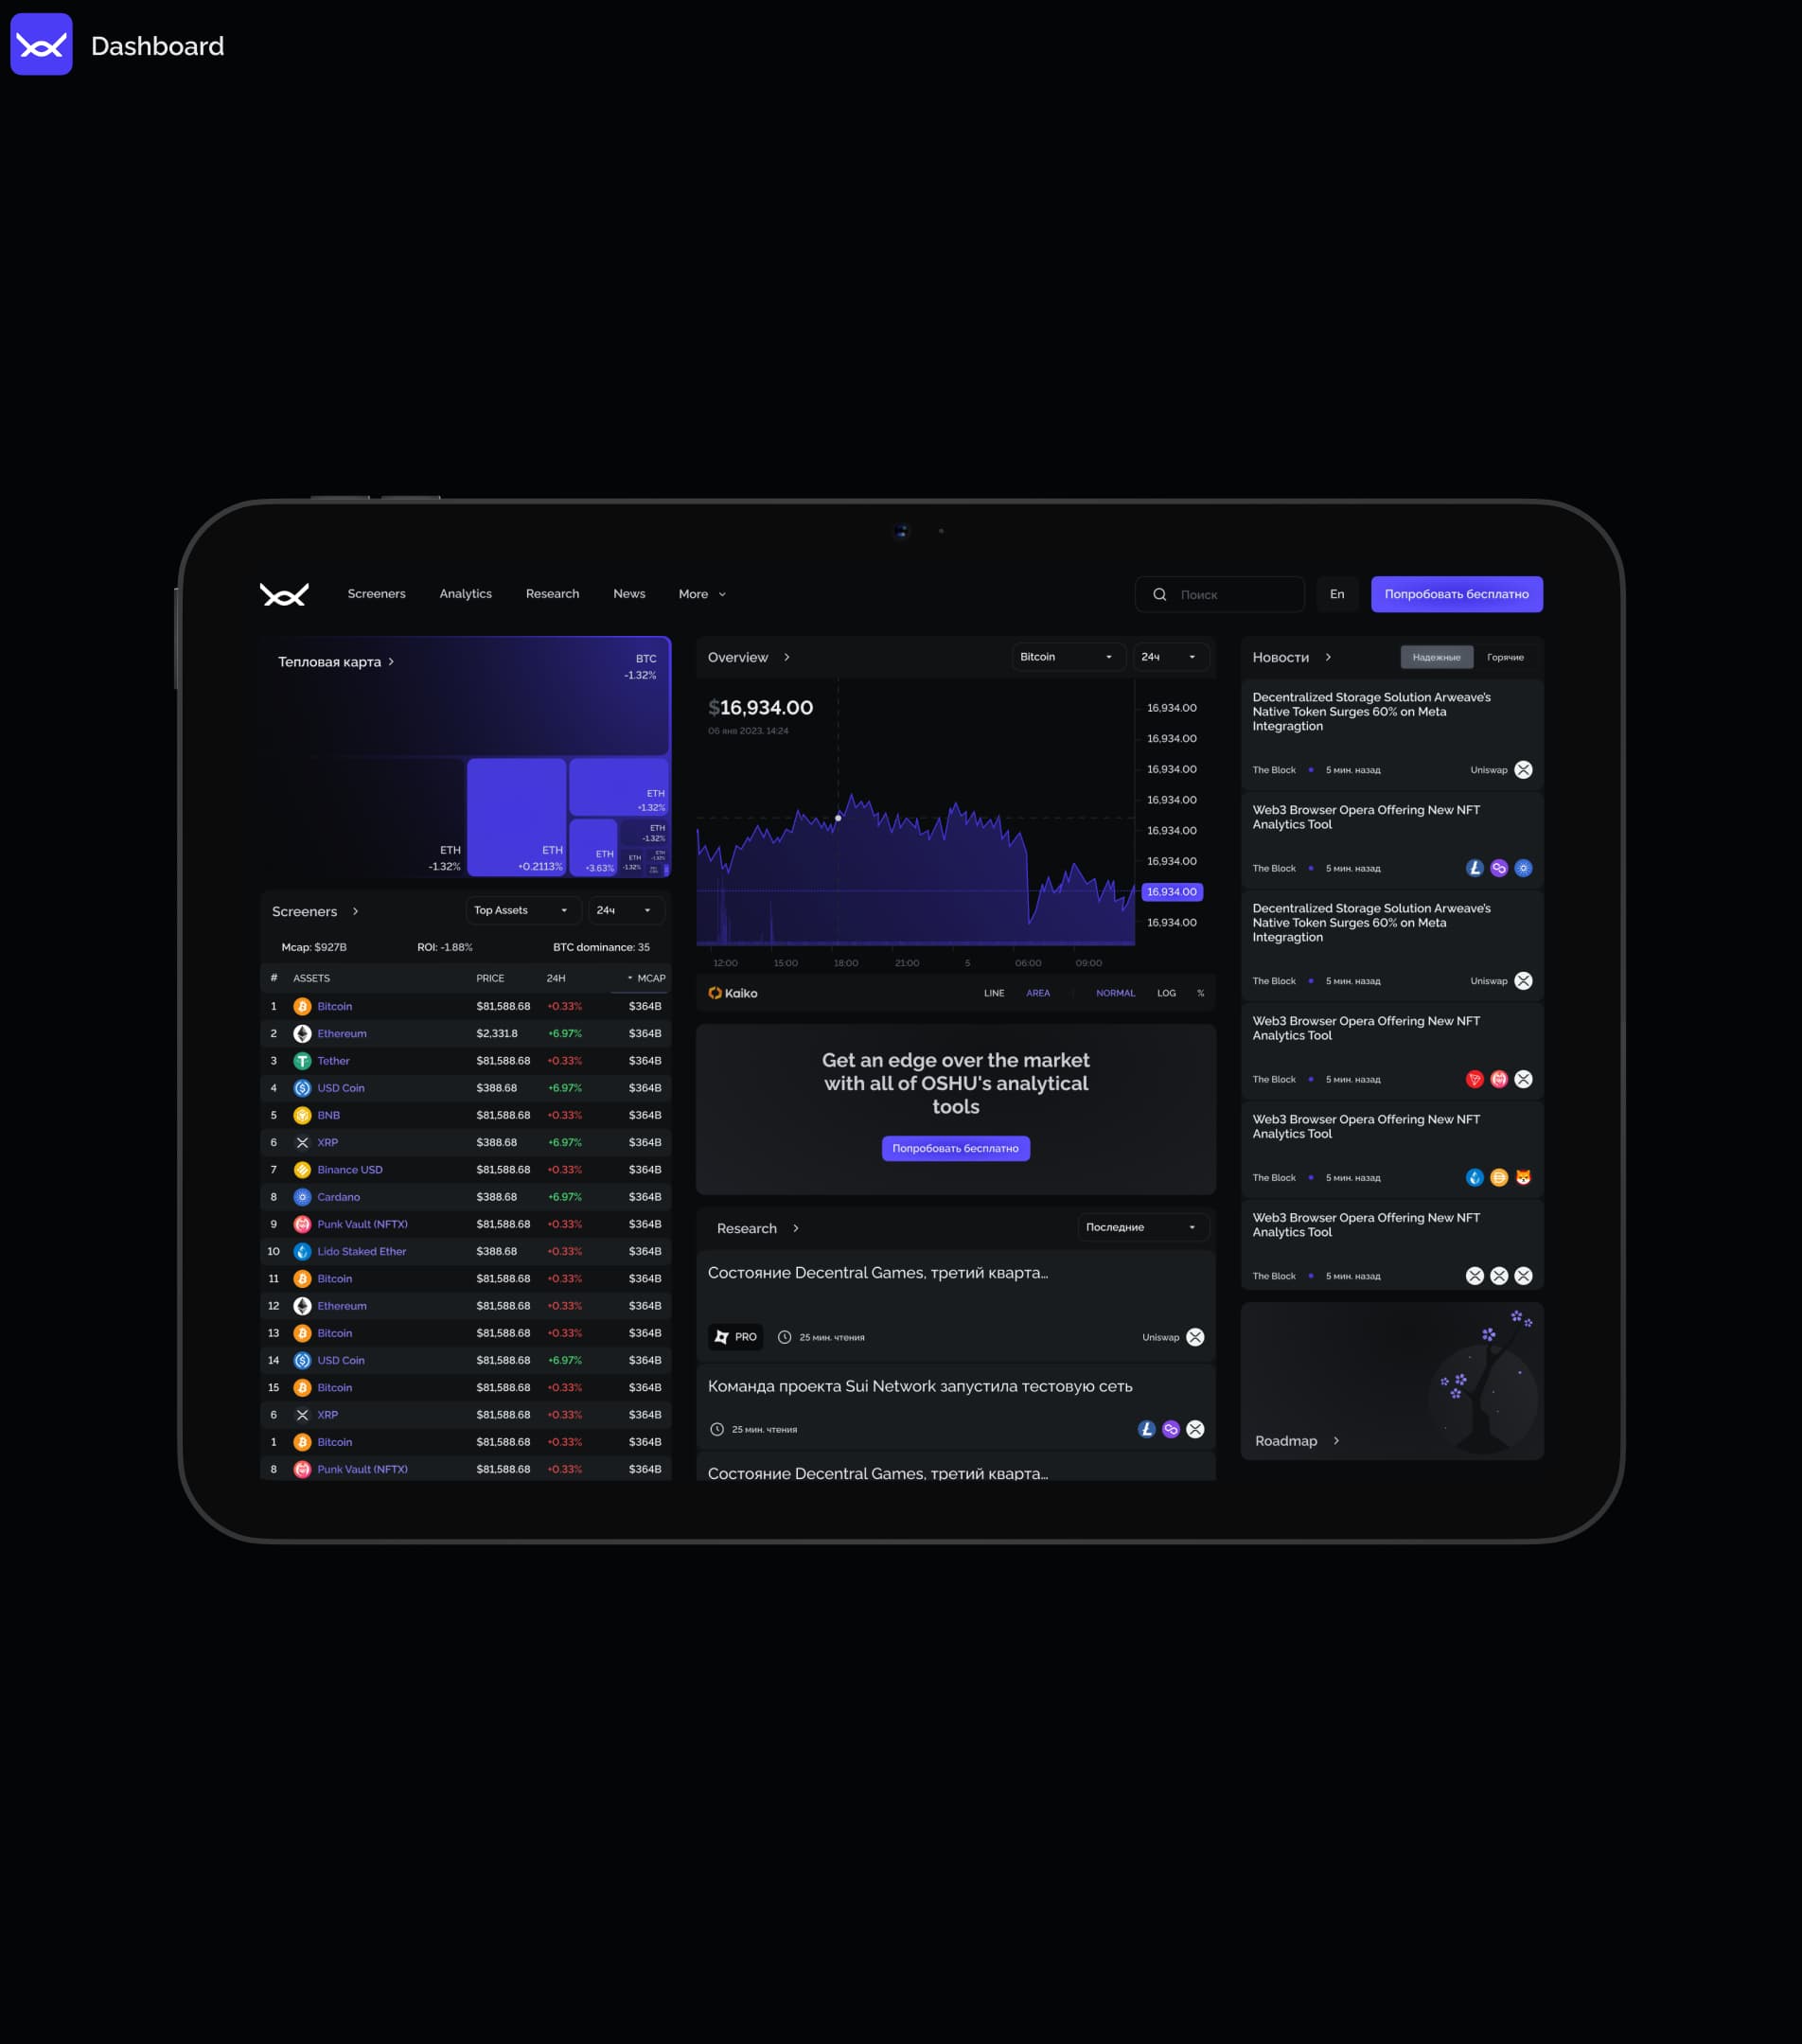
SIGN IN AND DASHBOARD
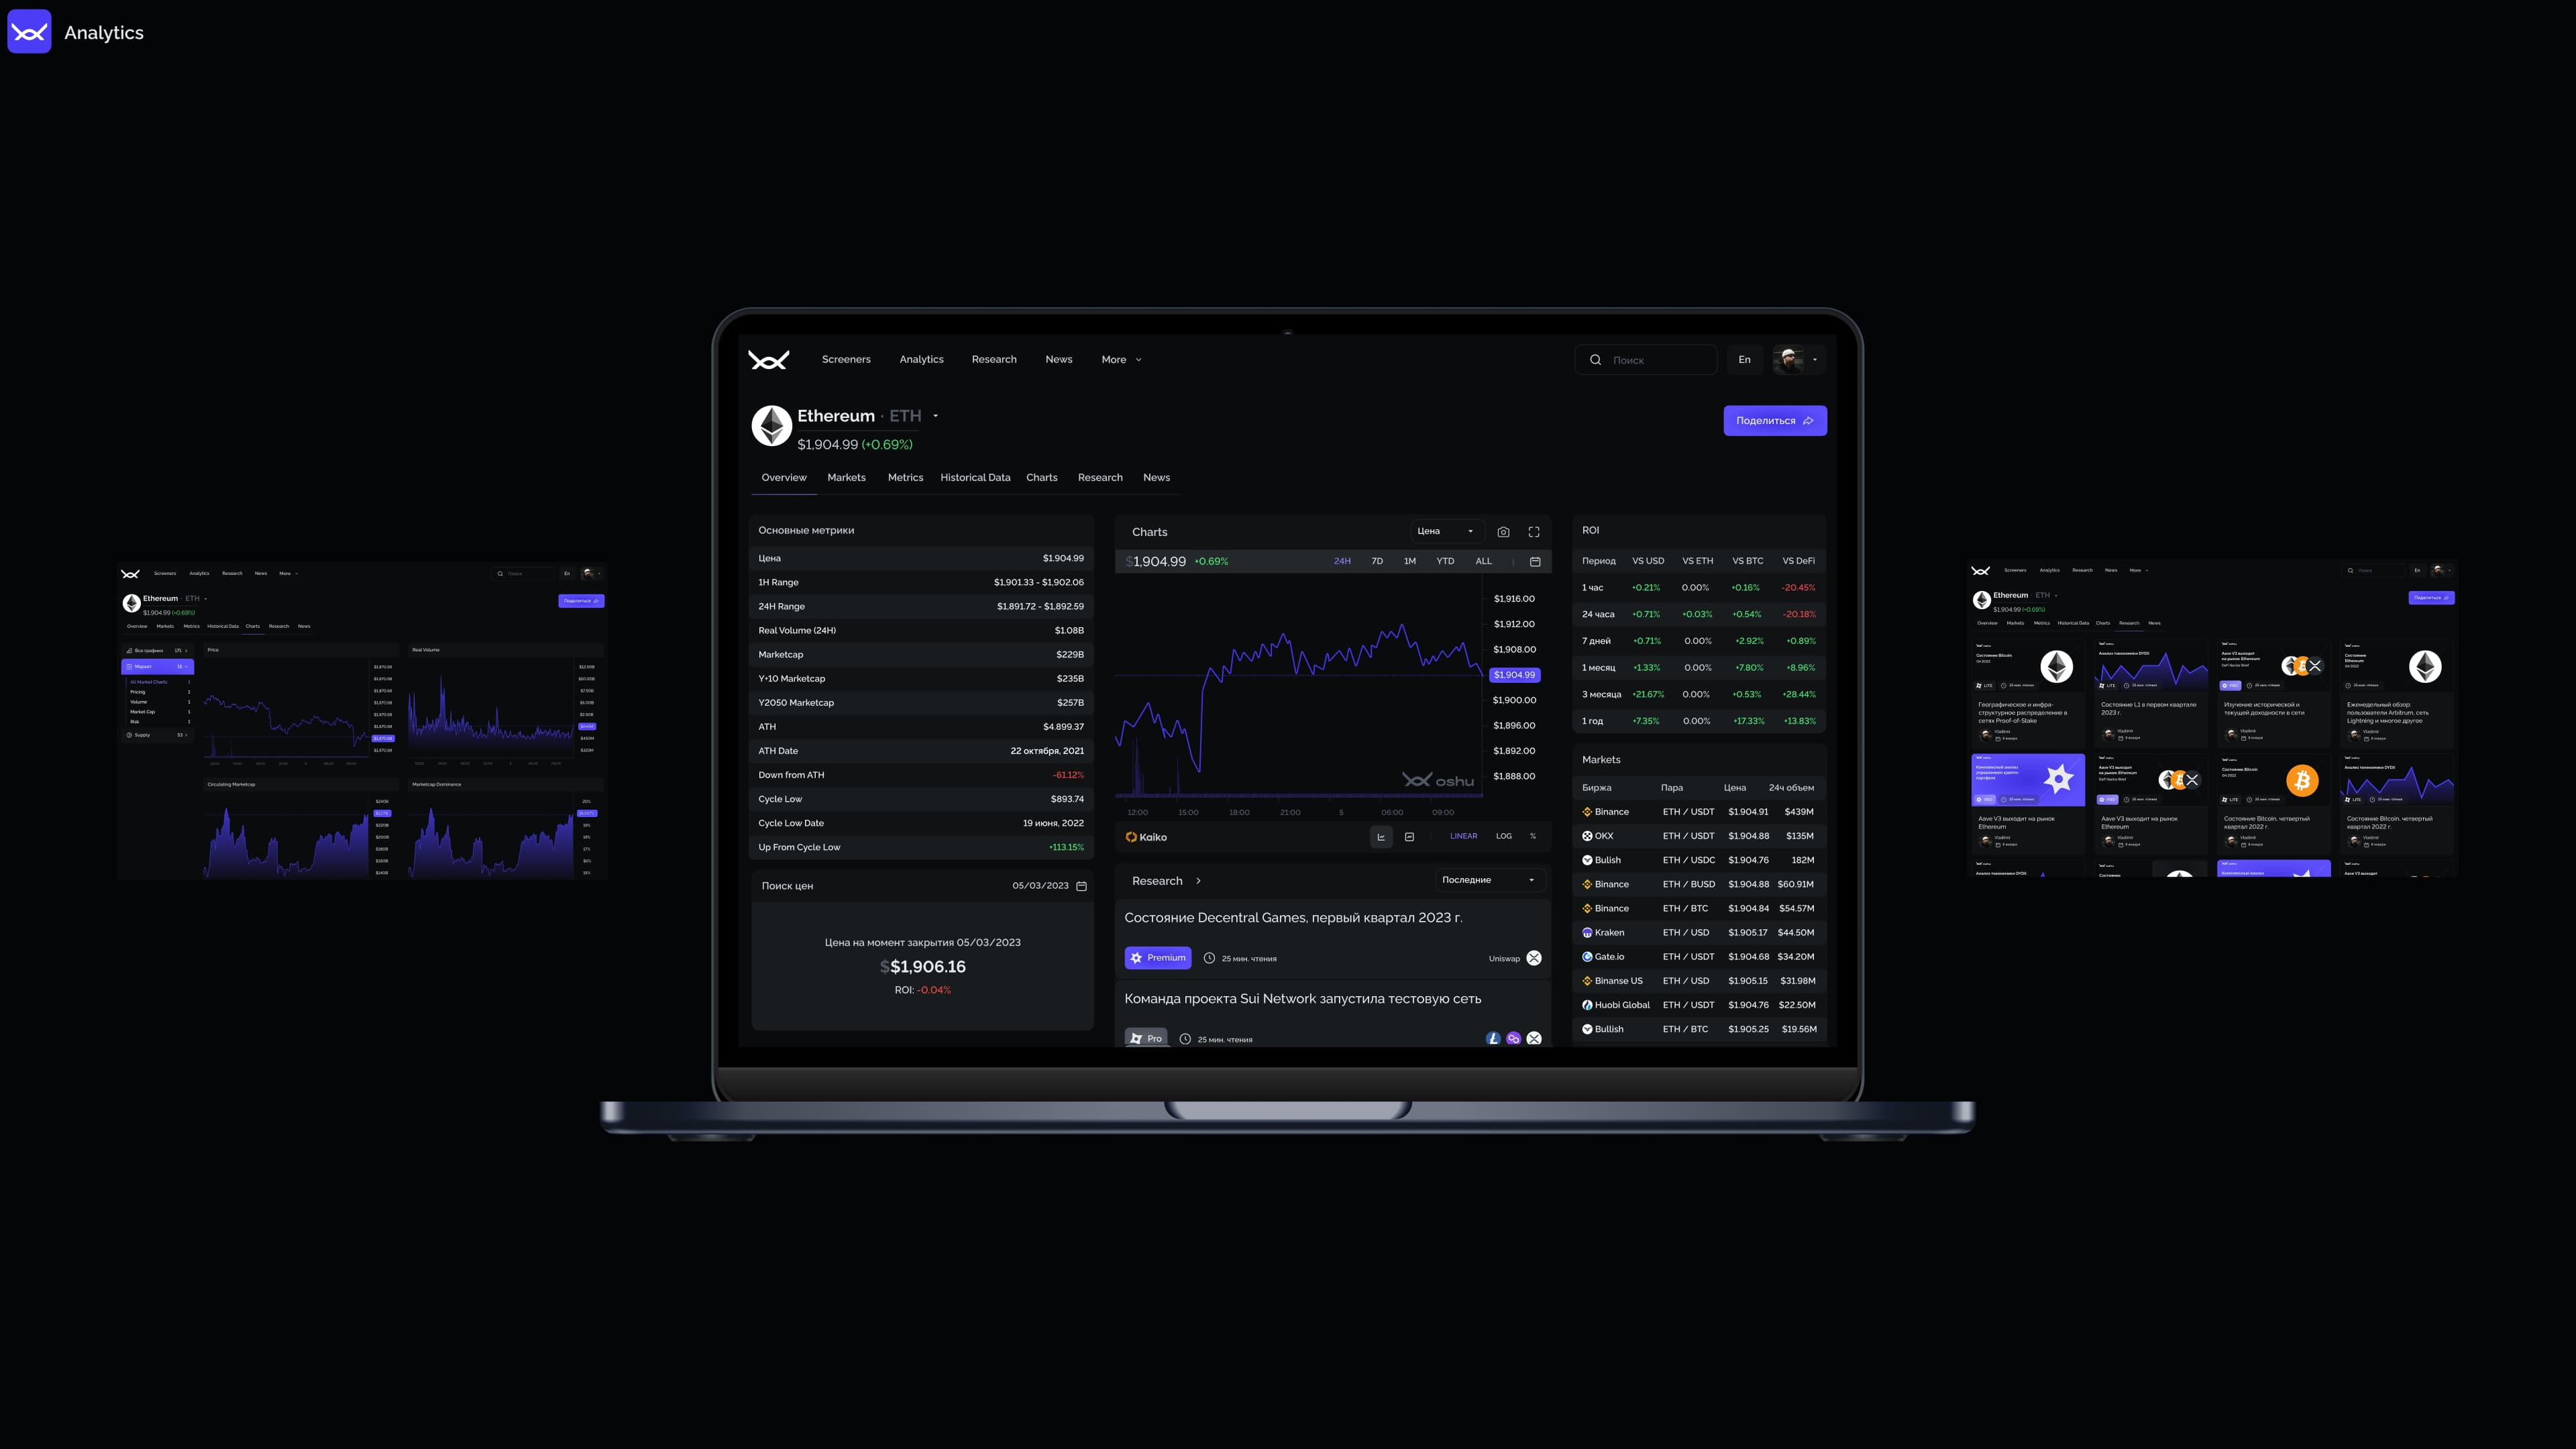
ANALYTICS
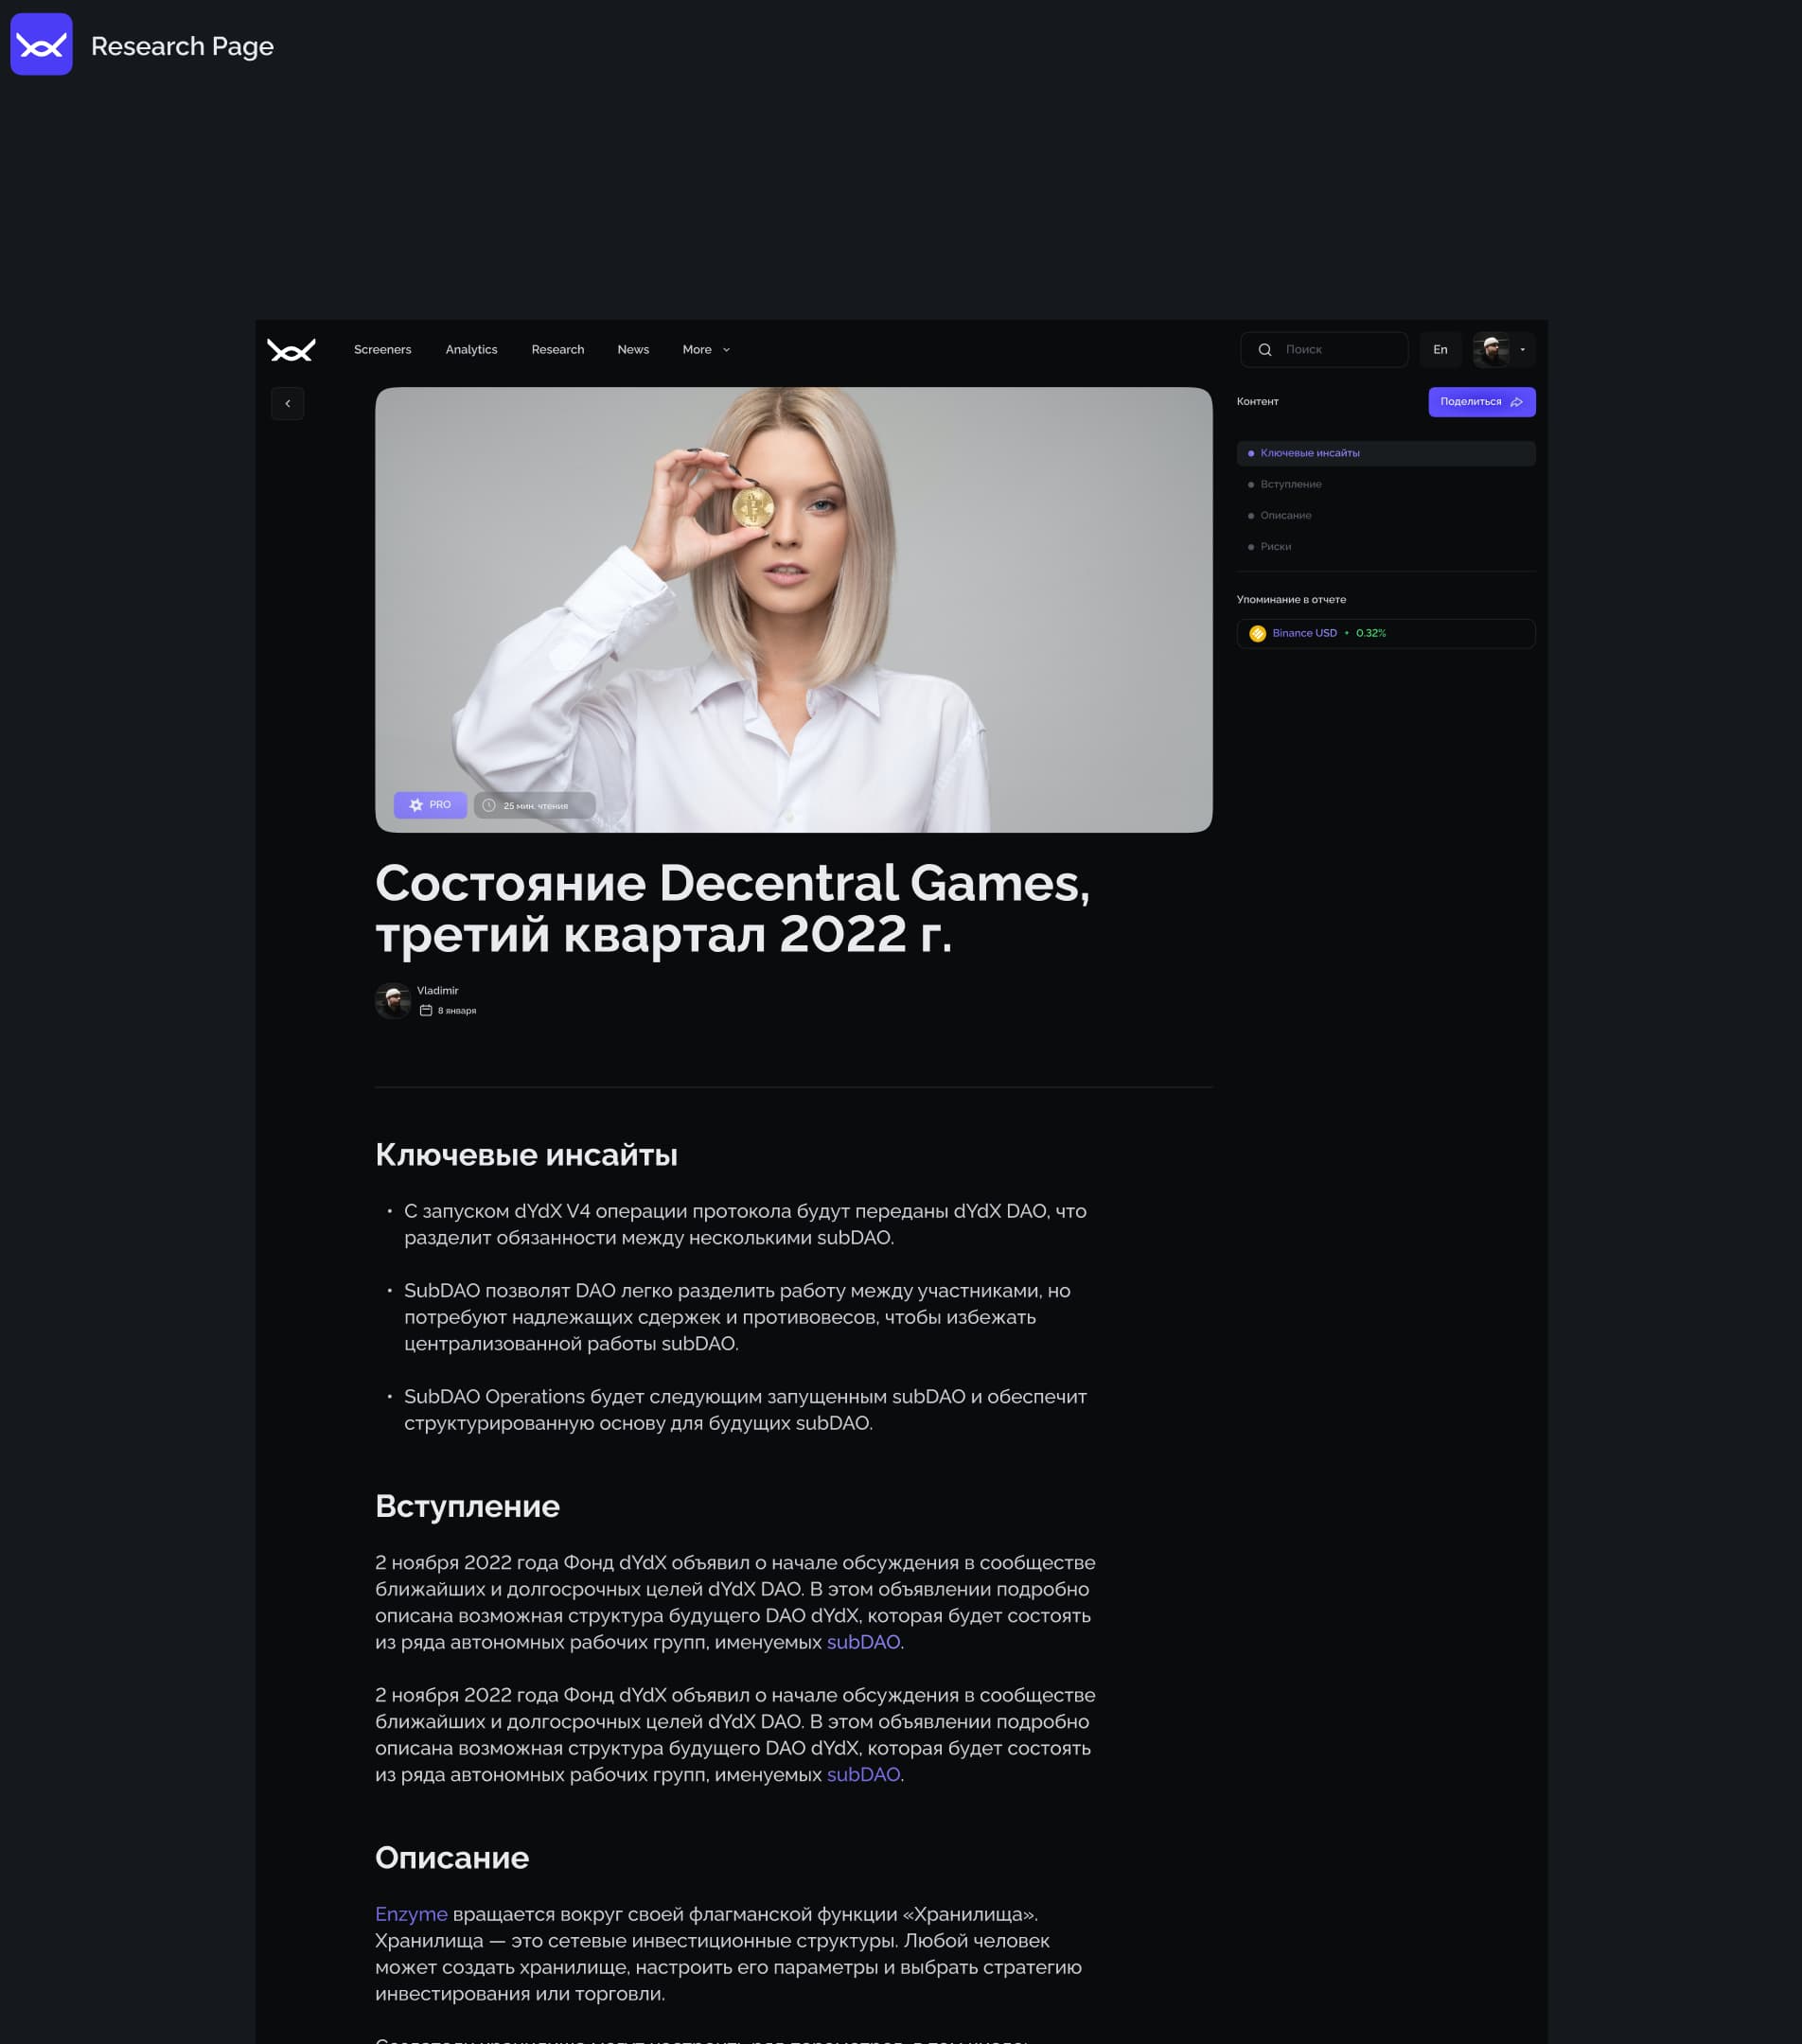
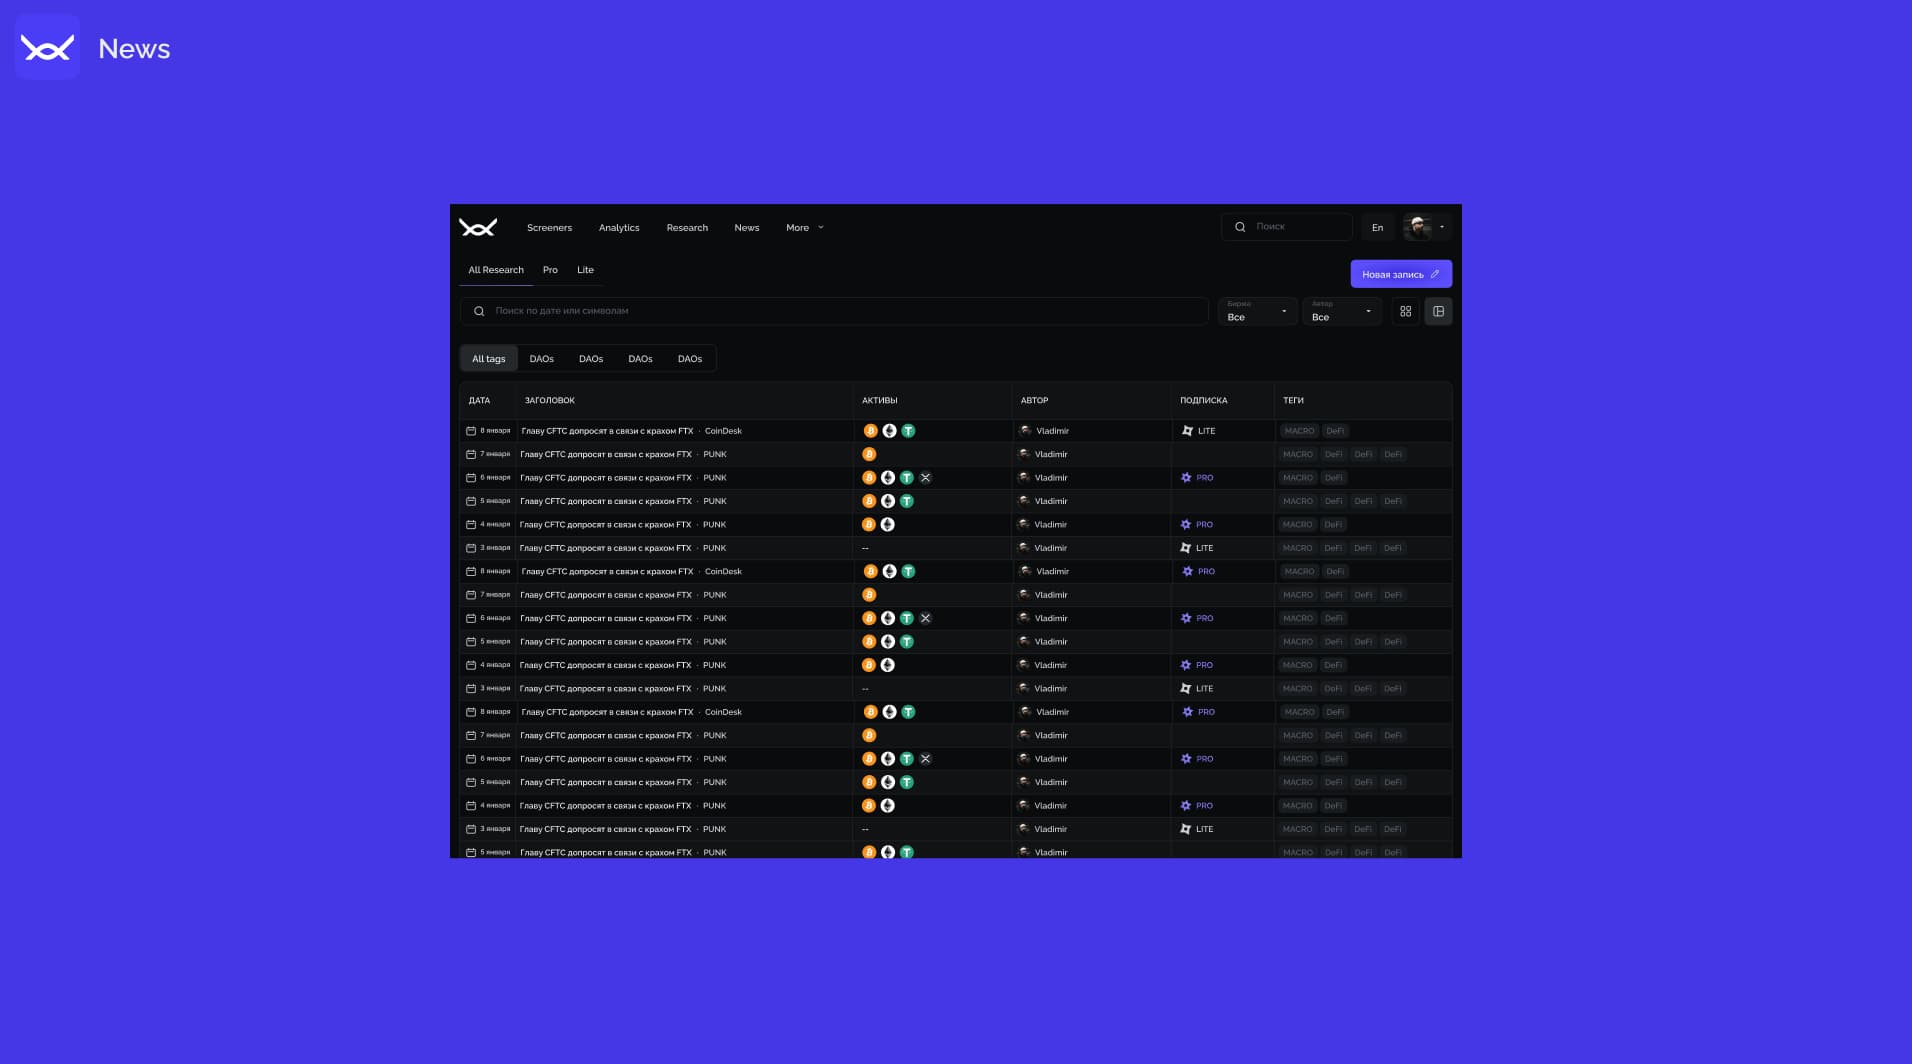
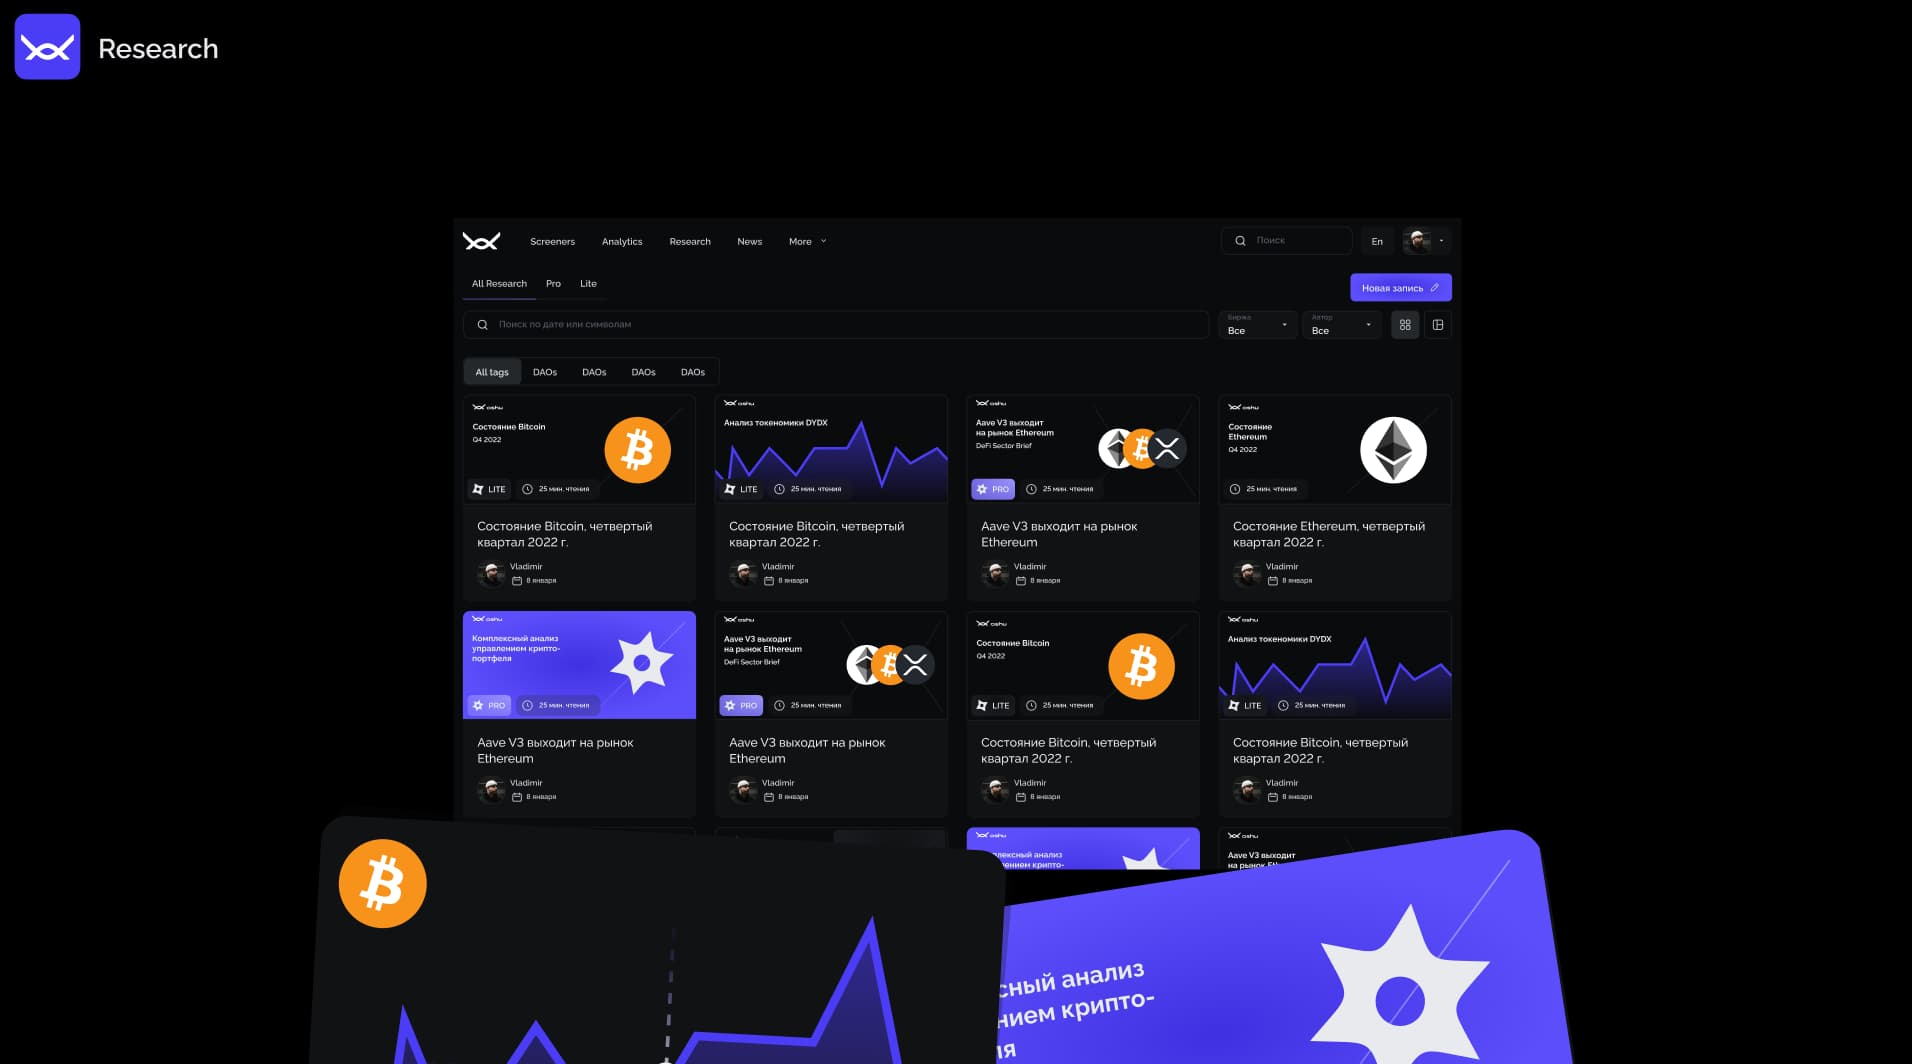
RESEARCH AND NEWS
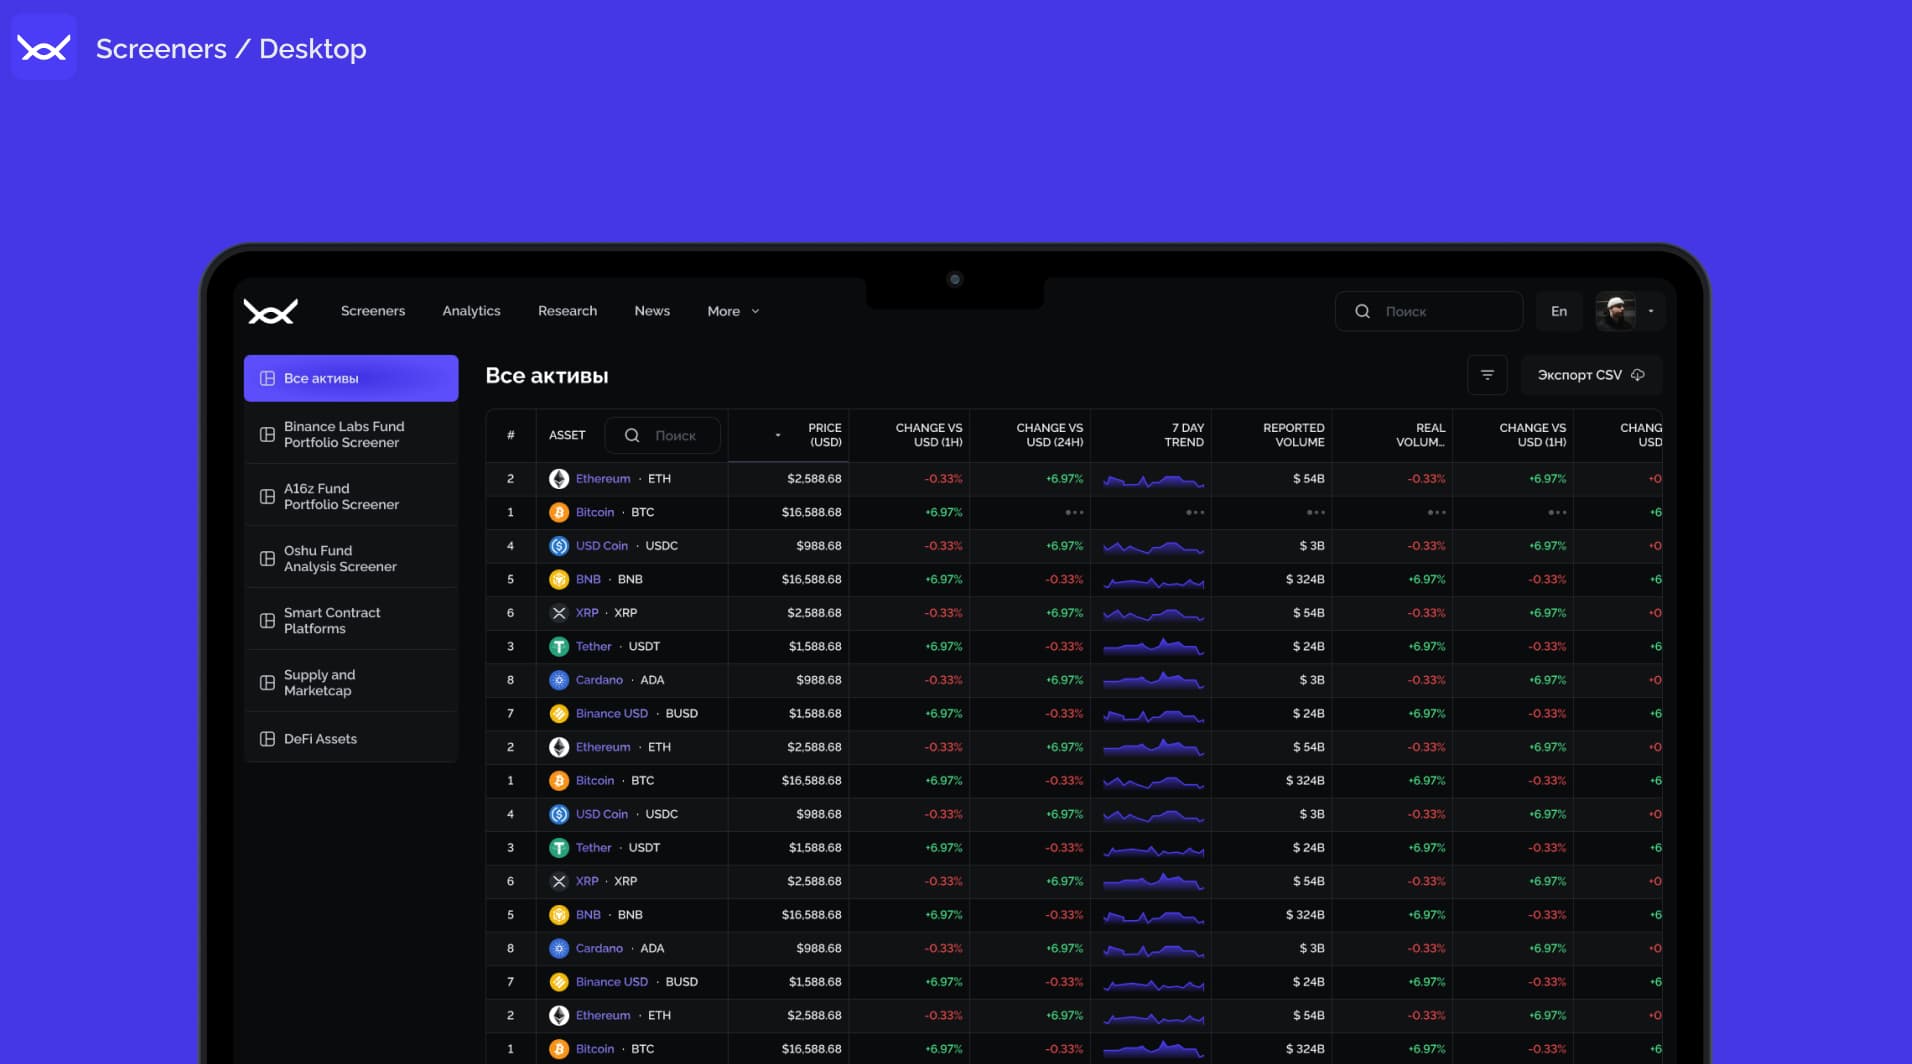
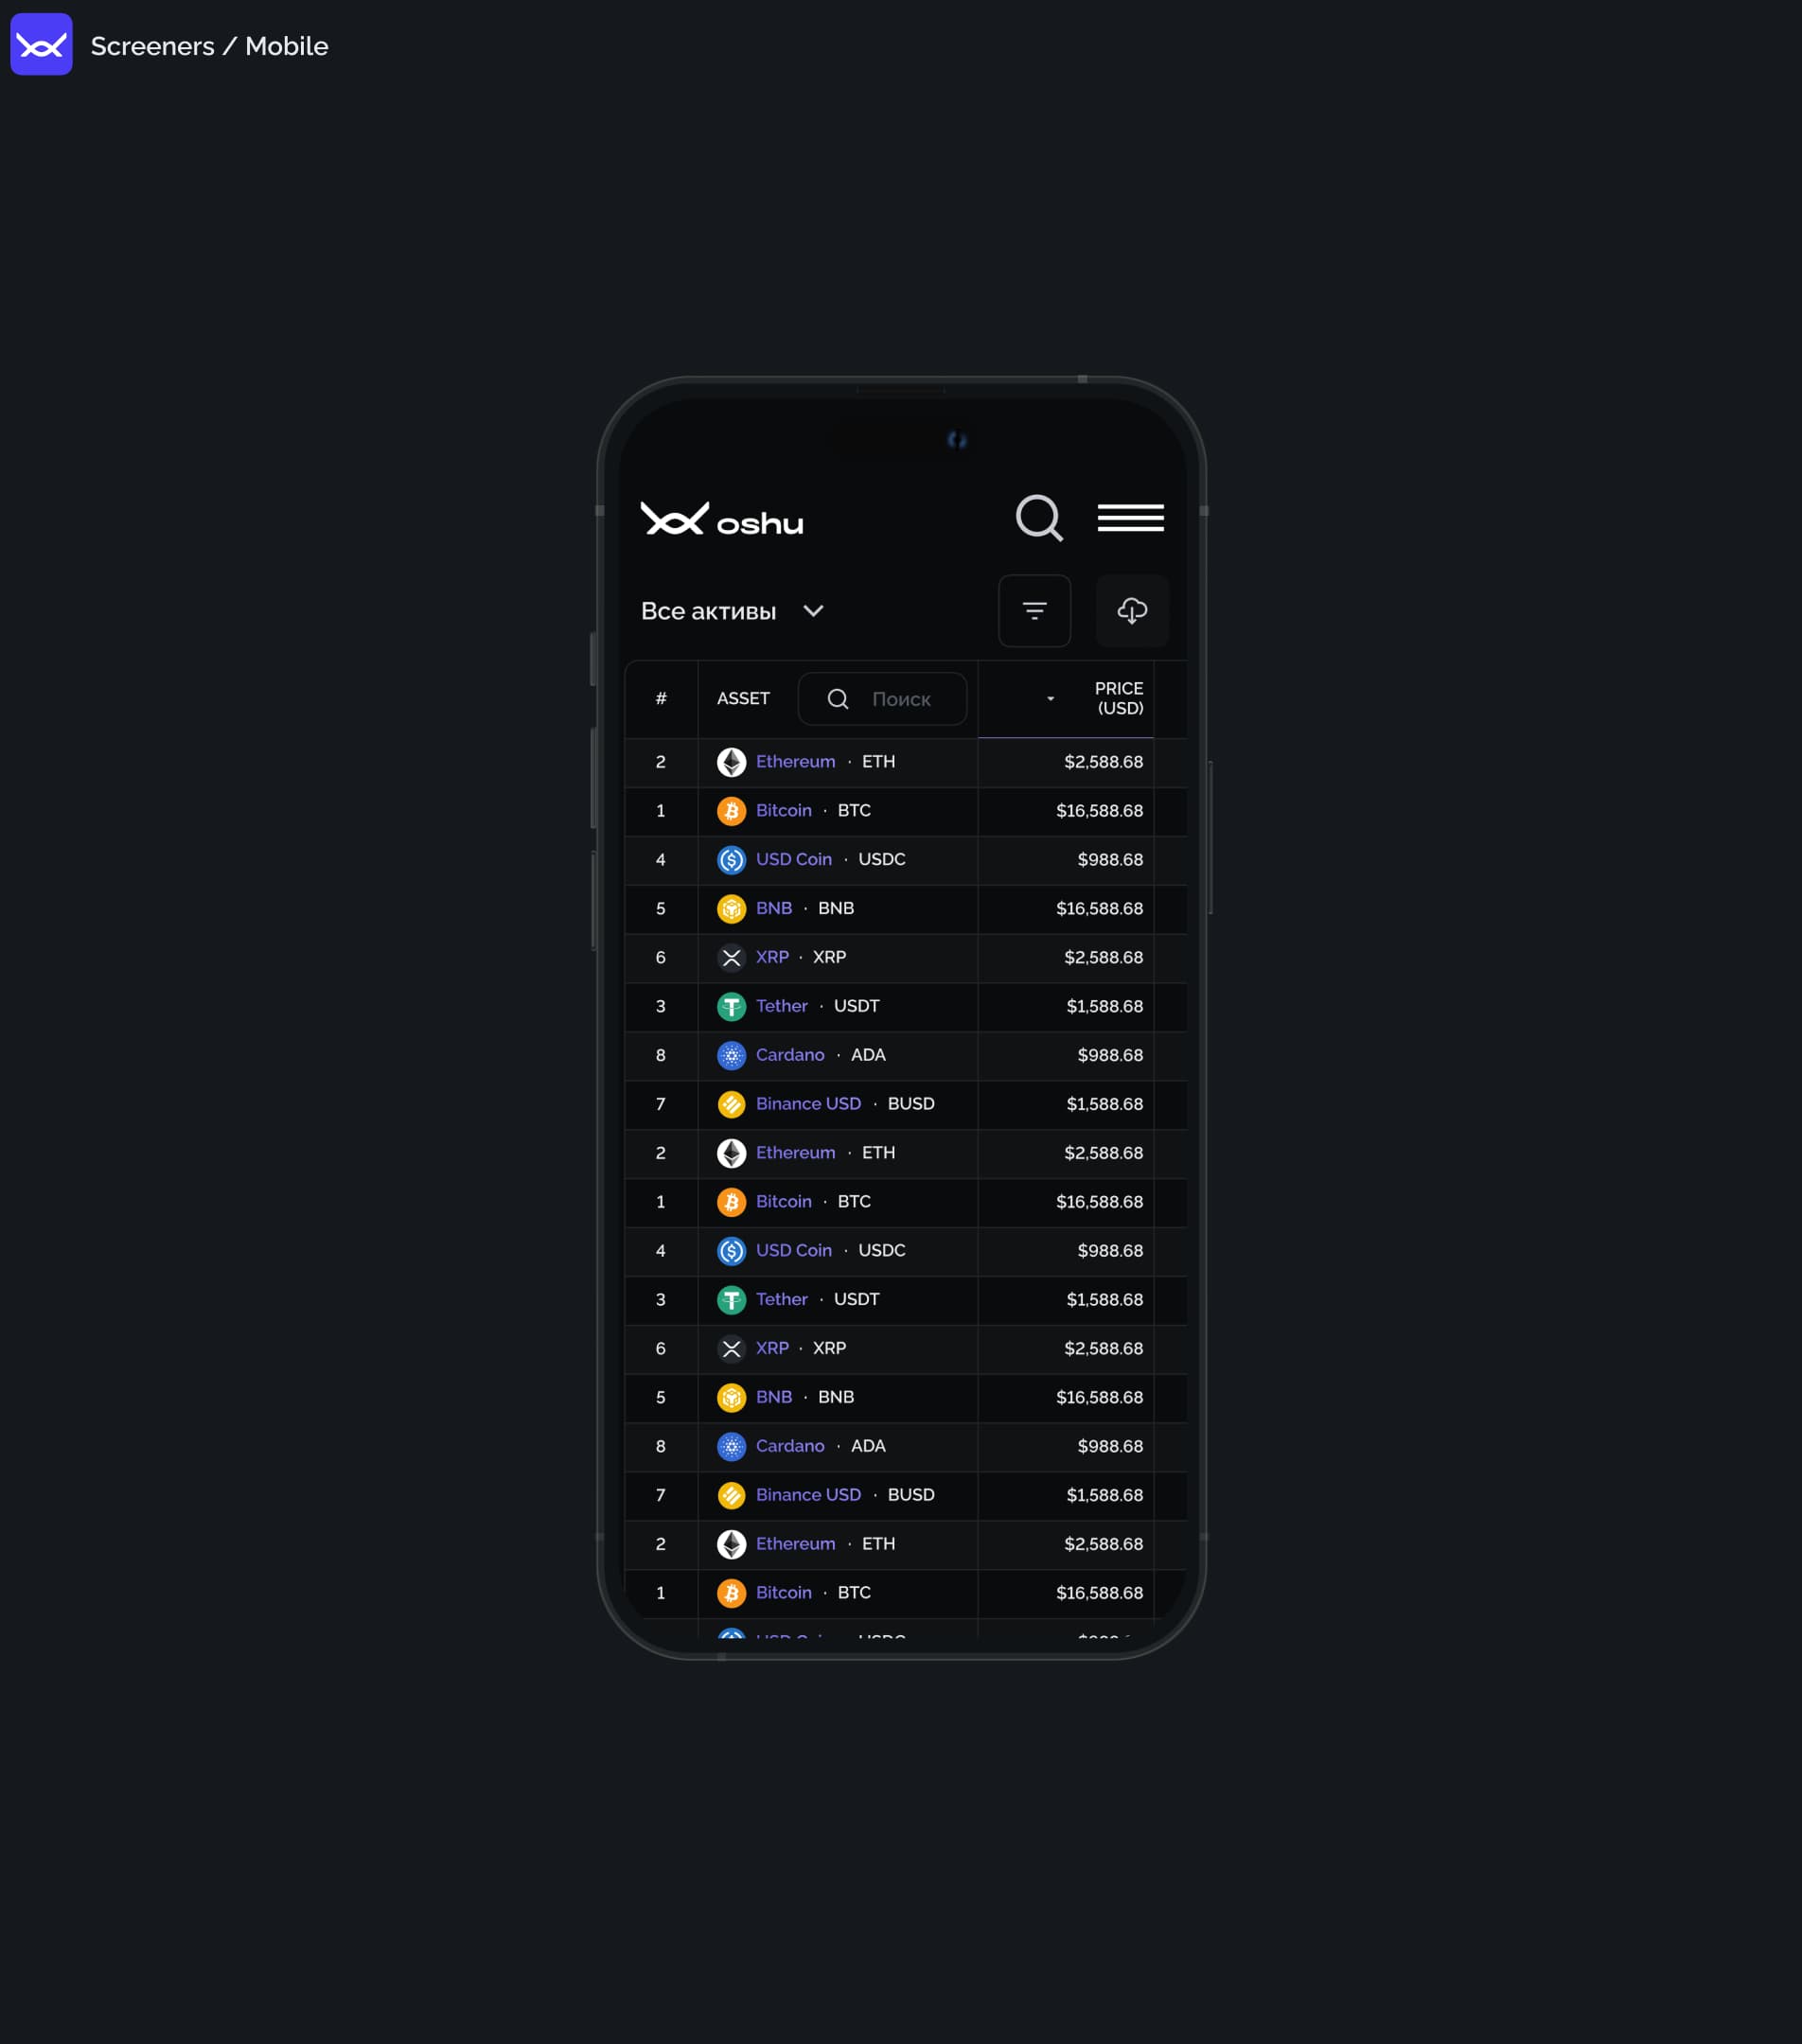
SCREENERS
For the mobile version, we reduced the amount of information shown on the screener while retaining the main metrics and functionality.
LANDING PAGE
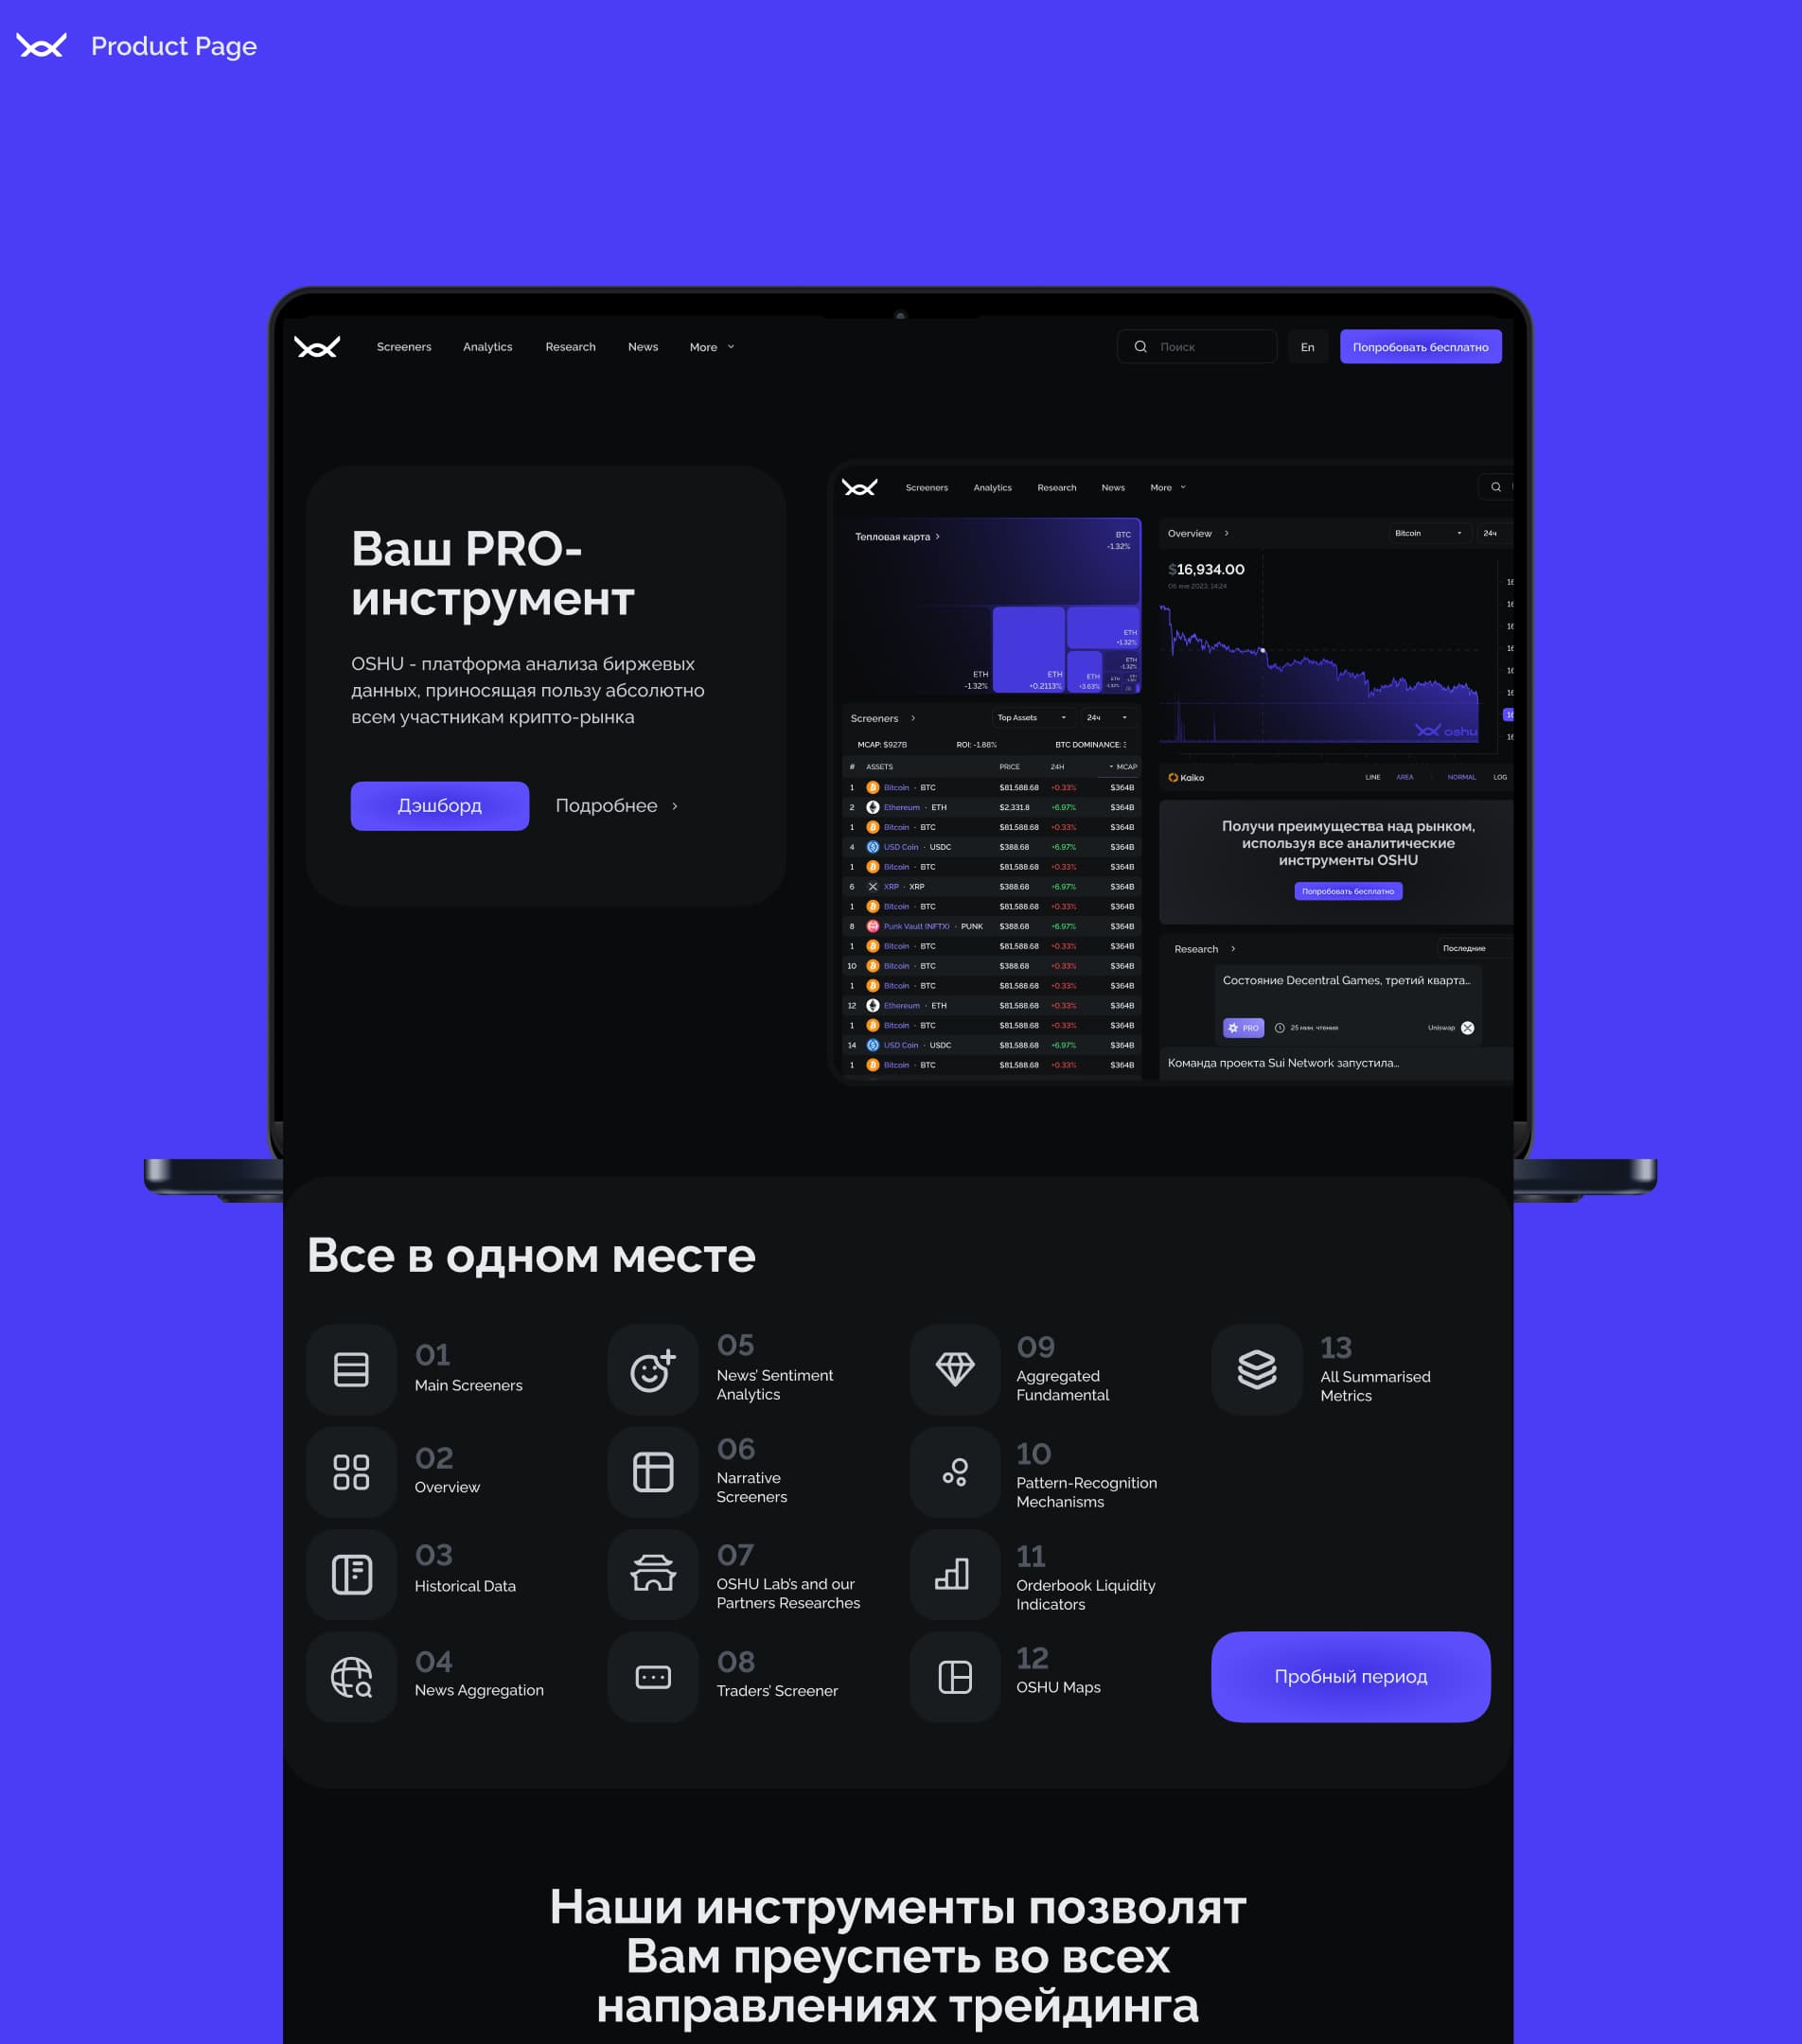
We designed a landing page for the public-facing side of the product that explains the platform’s capabilities, tools and future development, so the first release feels like part of a broader system.
VISUAL CONCEPT AND DESIGN SYSTEM
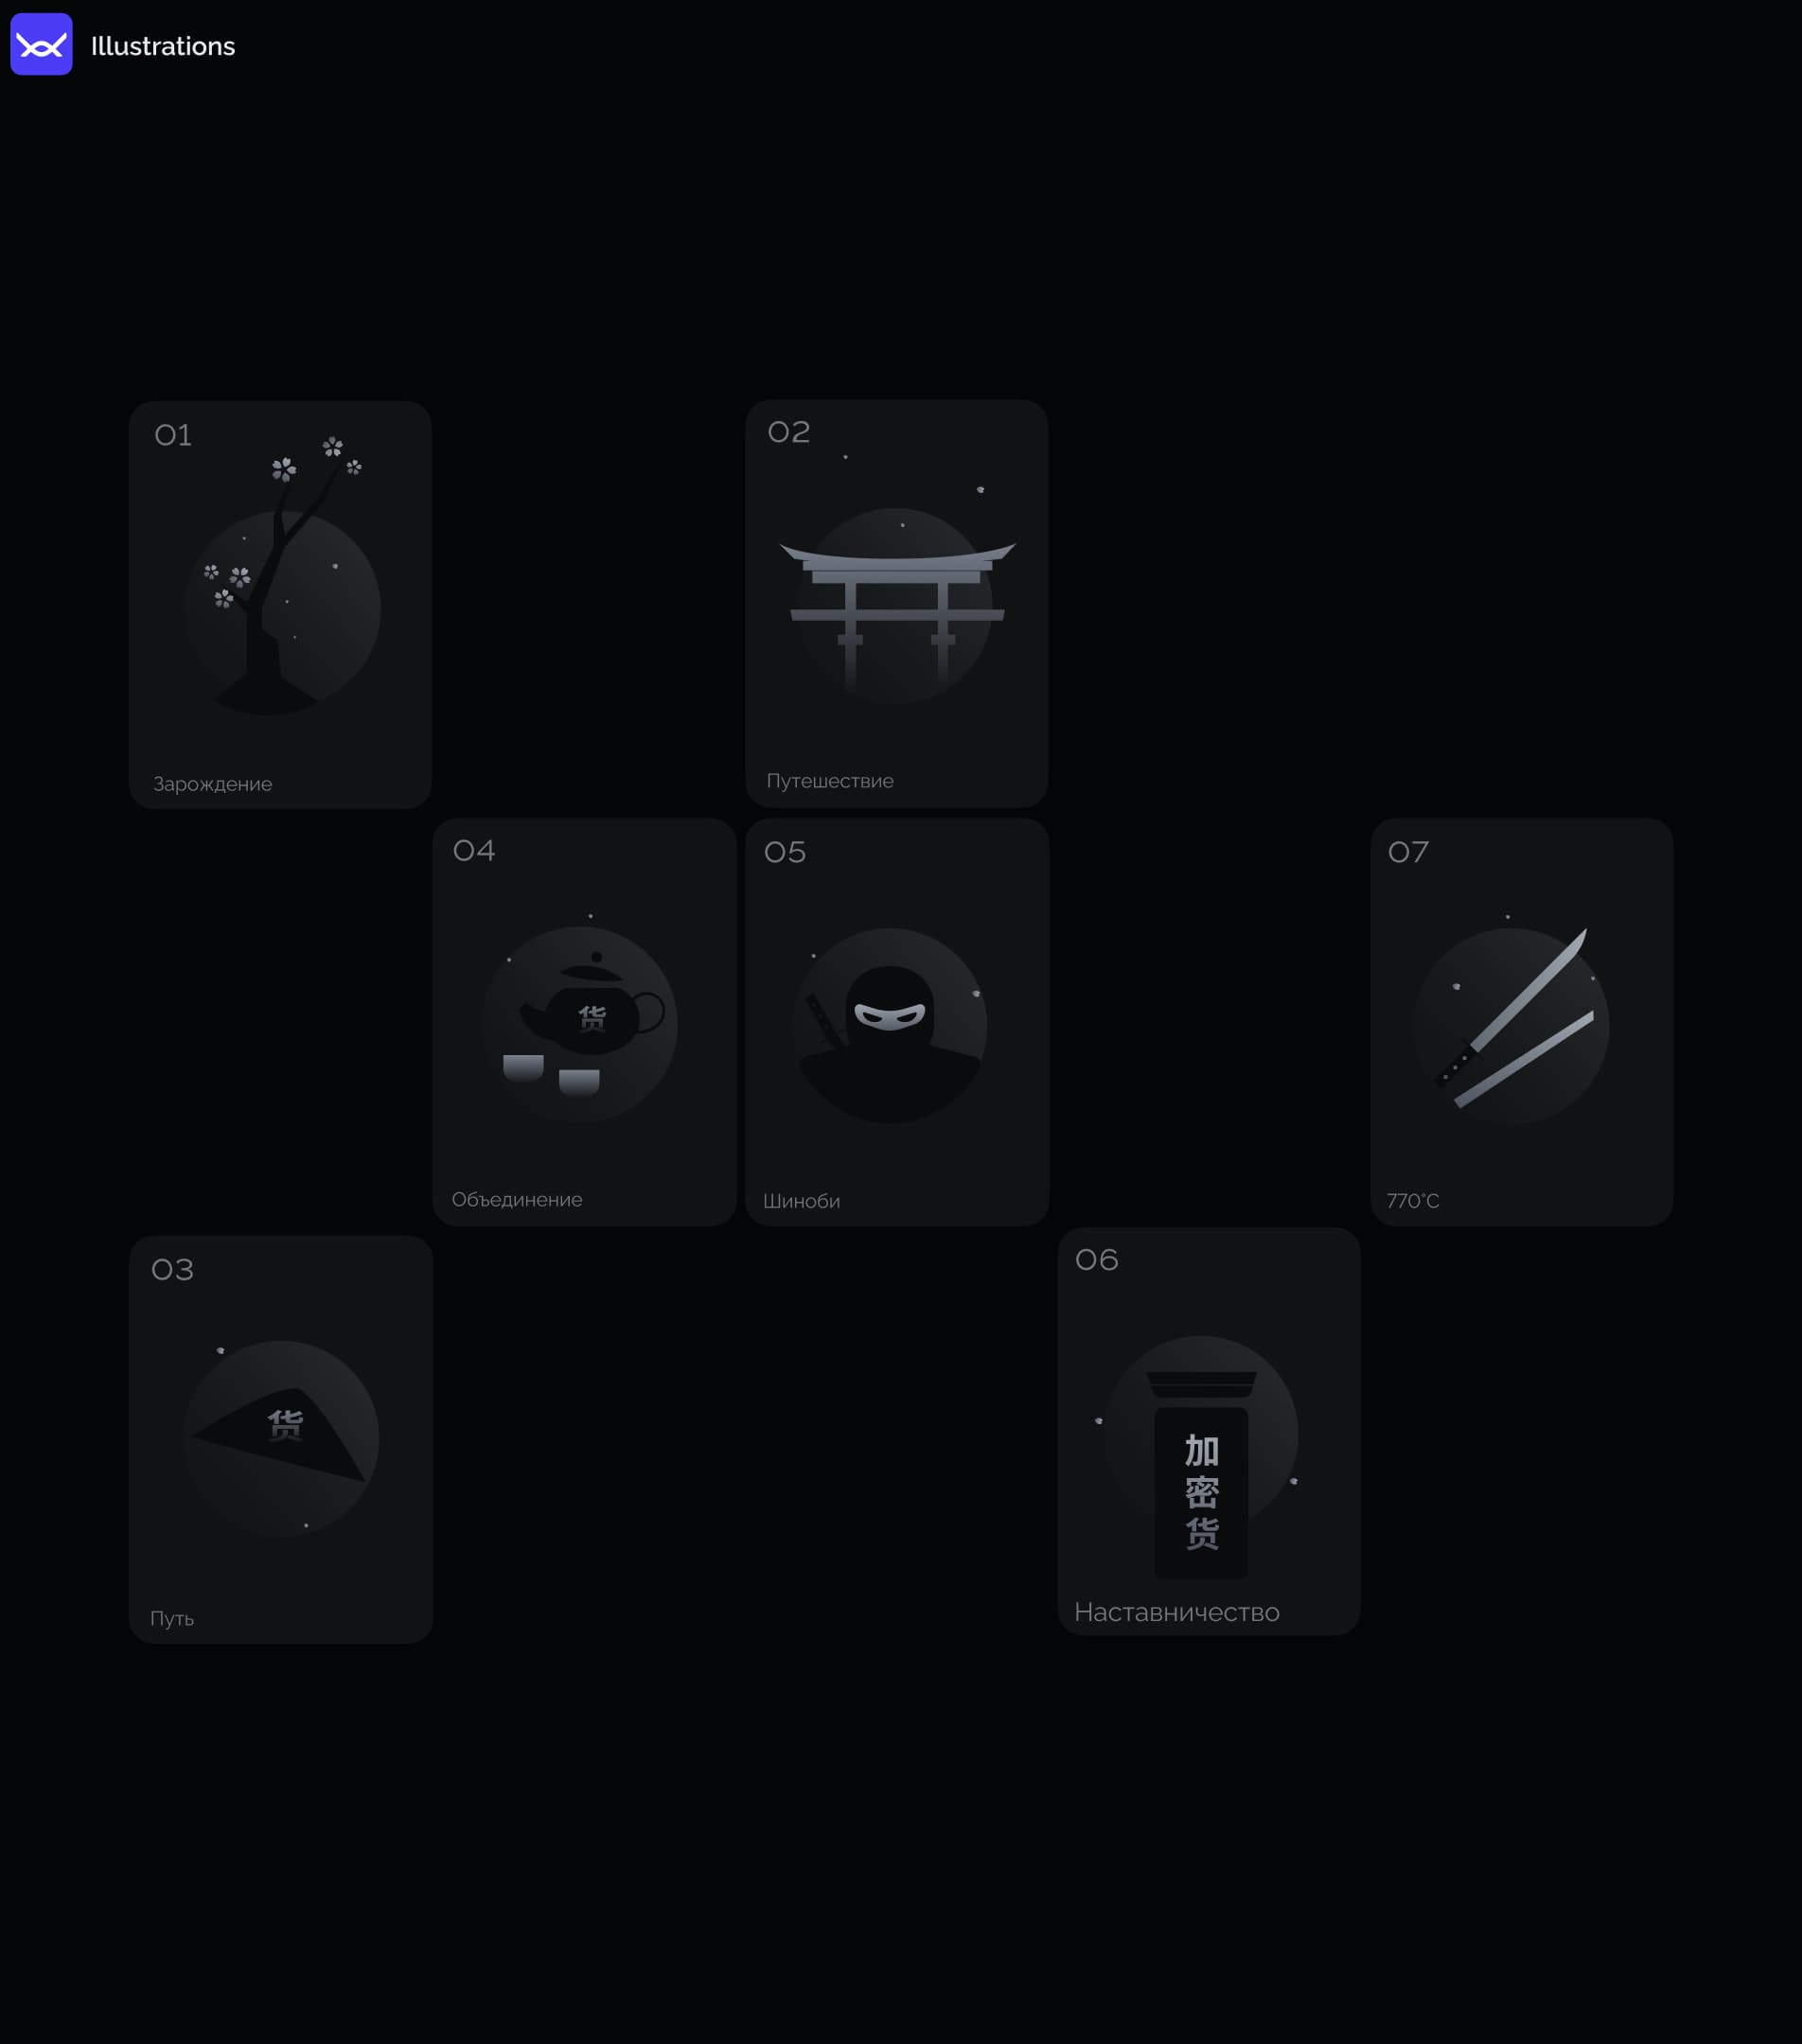
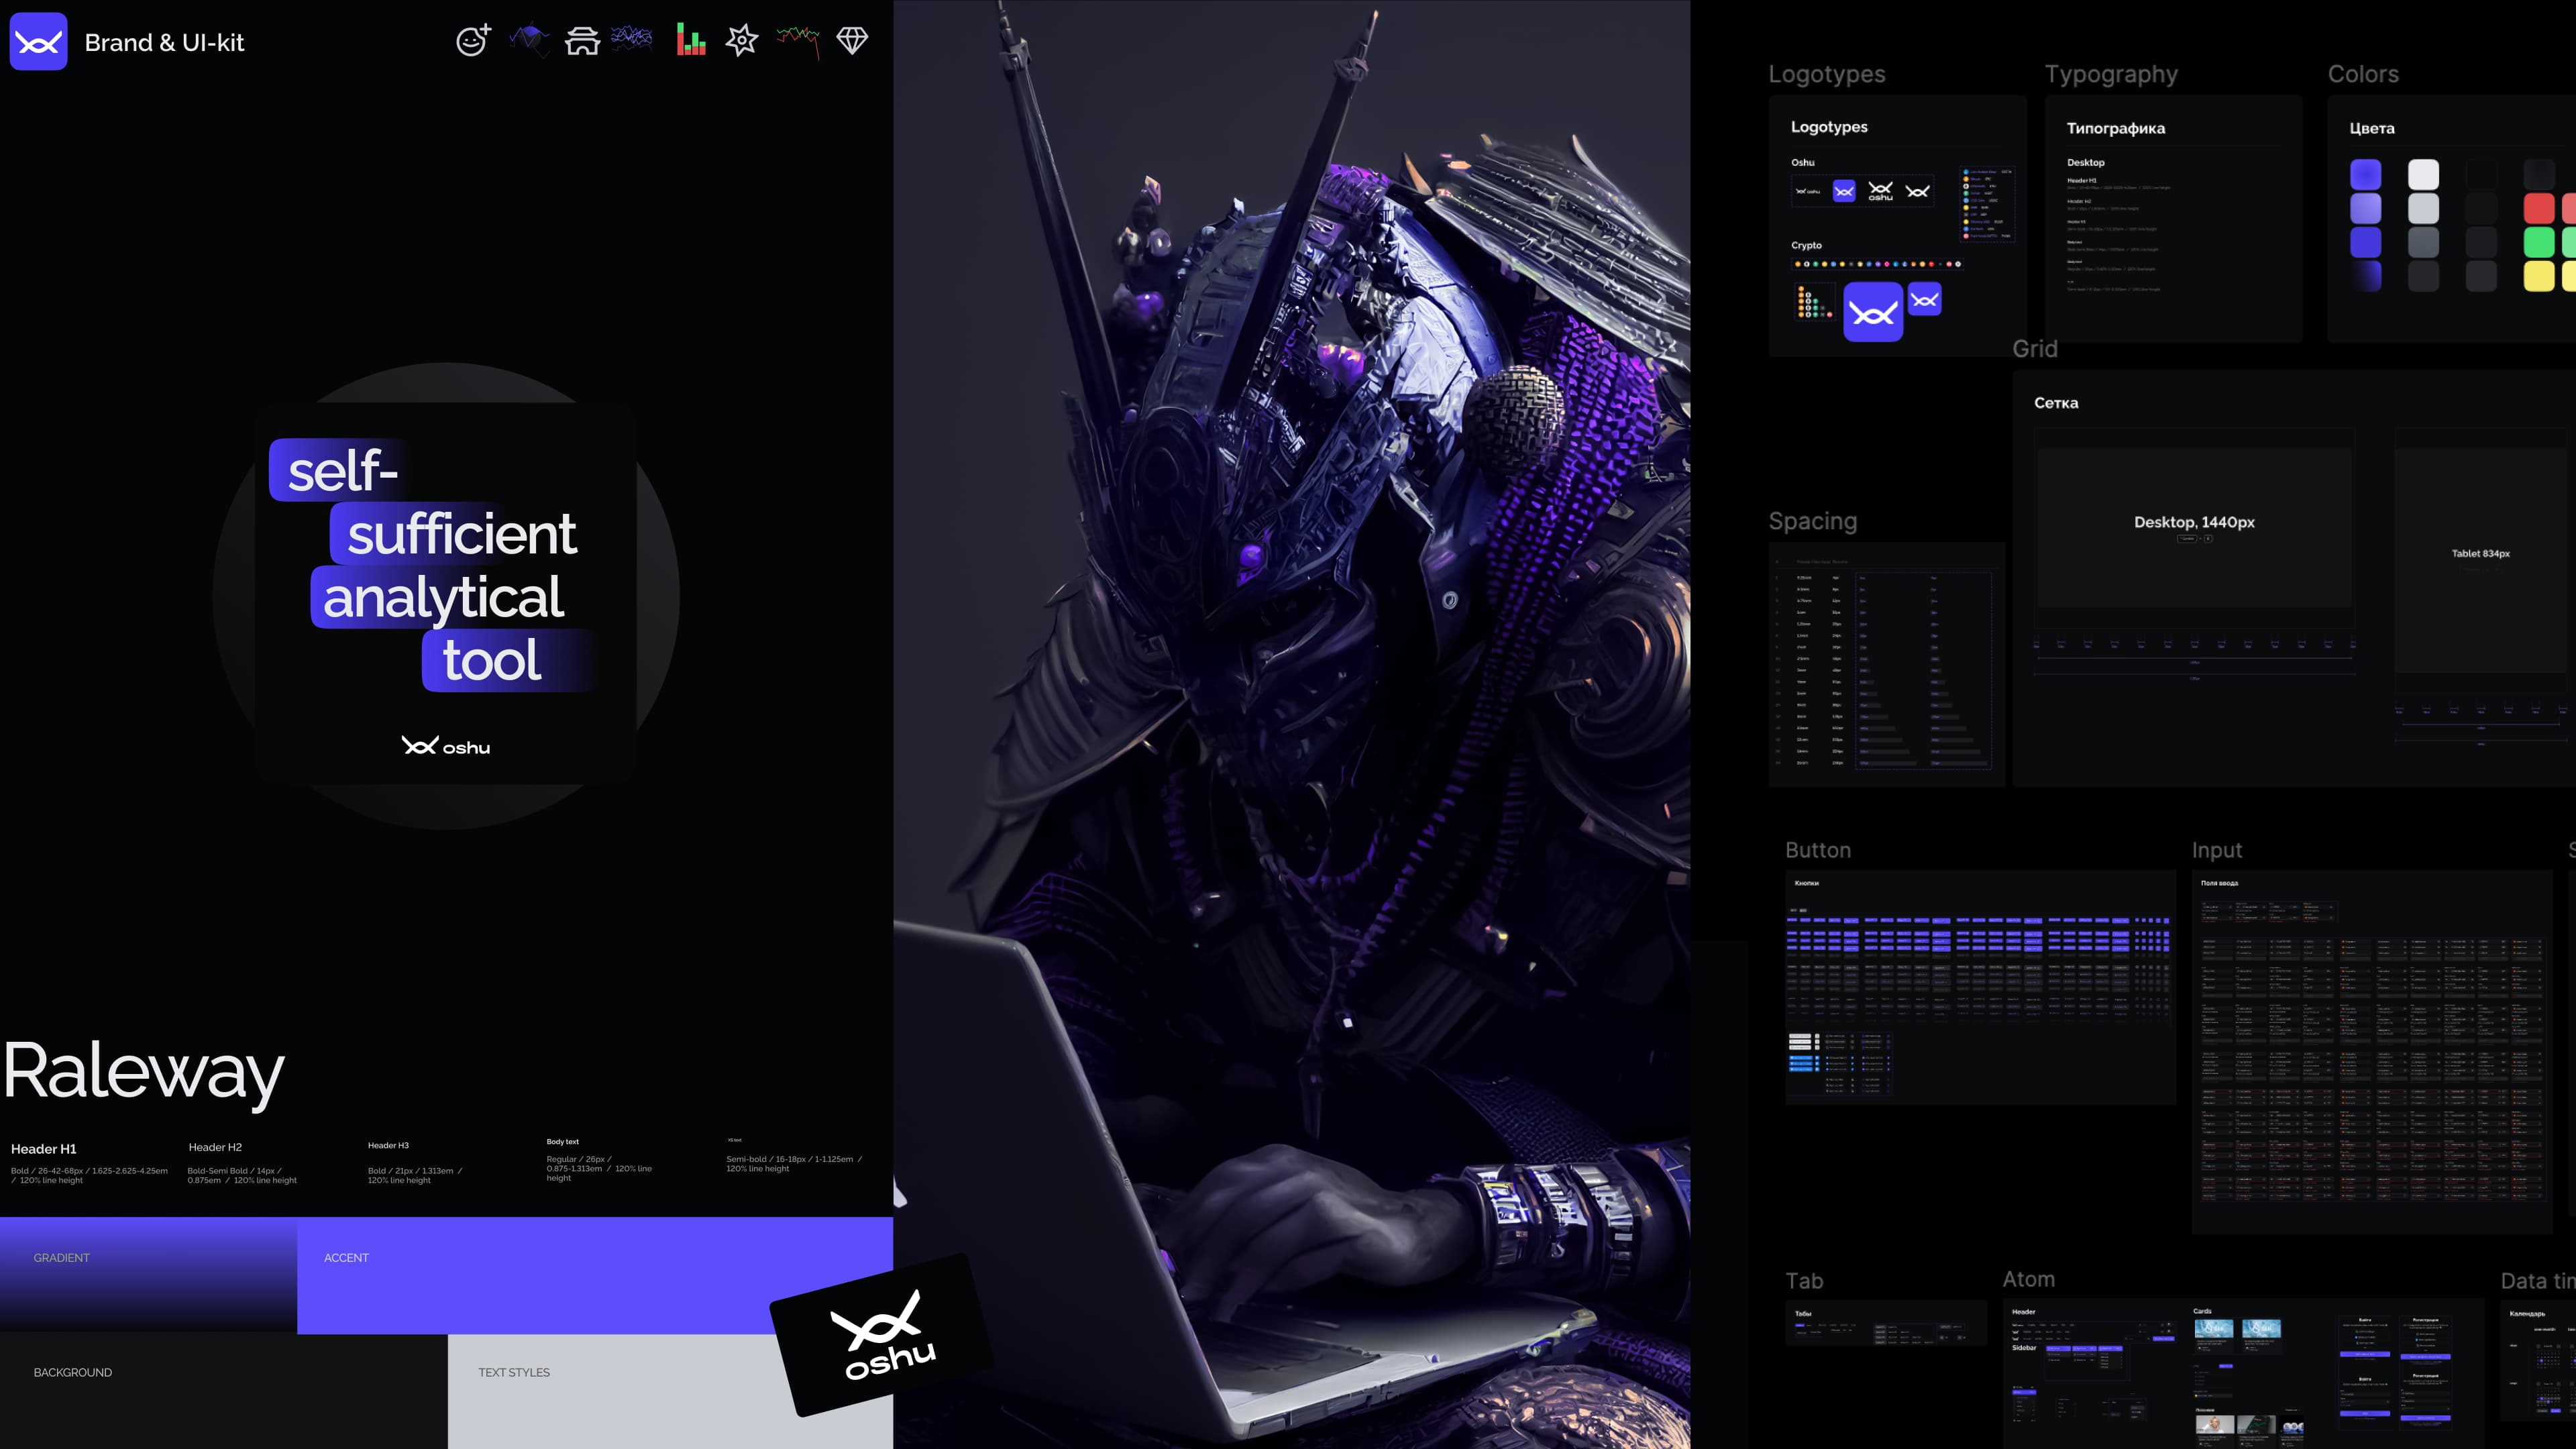
The visual concept was based on the image of a samurai. It conveyed discipline, focus and the ability to work with risk. This image shaped Oshu’s graphics and illustrations. The interface itself remained restrained so the visuals would not interfere with working with large volumes of data. Repeated elements were collected into a design system and component library for tables, charts, metrics and other analytical screens.